Mobile spectrometer


Print Profile(1)

Bill of Materials


- CD x 1: 1
- Tracing paper x 1: 1
Description
Boost Me (for free)
Greetings! I am a maker with a passionate dedication to design and innovation. Through 3D modeling and printing, I translate concepts into tangible realities. Your support enables me to create elegant, practical solutions! Ways to Contribute: •Experiment with My Designs: Test them and provide valuable feedback. • Spread the Word: Share my creations within your network. • Collaborate or Offer Encouragement: Your support fuels my creative pursuits! Thank you!
Introduction
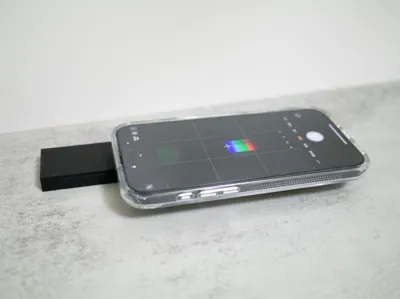
Here’s a simple but fully functional DIY smartphone spectrometer, built using nothing more than a CD and a 3D printed enclosure.
It’s designed for science education and maker projects. By using the spiral grooves of a CD as a reflective diffraction grating, it splits ordinary white light into a colorful visible spectrum—making wavelength separation easy to observe.
The entire body is 3D printed and compatible with most modern smartphones (≤Ø16mm lens). With just a few basic parts and minimal tools, it’s quick to assemble and perfect for classroom demonstrations, science fairs, or home experiments.
What You’ll Need
- CD (reflective grating) – Use a blank, unused CD for best diffraction clarity
Slit module (0.1–0.2 mm width) – 3D printed; requires precise XY calibration. Ideally, the slit should fit a single sheet of A4 paper (≈0.104 mm thick)
Strongly recommended: calibrate your printer before slicing
Calibration model
https://makerworld.com/models/1307486
Bambu Lab guide
https://wiki.bambulab.com/zh/software/bambu-studio/xy-hole-contour-compensation
- 3D printed body – Matte black PLA is recommended to minimize reflection and diffuse scattering while maintaining good rigidity.
- Tracing paper (optional) – Helps diffuse bright light sources
Fine sandpaper (optional) – Reduces internal reflection for better contrast

Key Highlights
- Perfect for science classes, maker demonstrations, or at-home STEM exploration
- Modular components for easy replacement or upgrades
- Compatible with most smartphones, including iPhone and Android devices
Suggested Light Sources for Classroom Experiments
This device can be used by educators to demonstrate the spectral characteristics of various light sources:
- LED bulbs – Discrete band spectrum with sharp transitions
- Fluorescent lamps – Spiky, jagged emission spectrum
- Sunlight – Continuous blackbody spectrum
Laser pointer – Single-wavelength monochromatic light
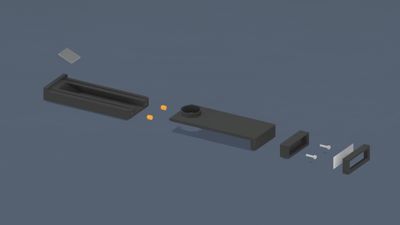
Assembly Steps
Design Principle: Diffraction Grating Equation
This spectrometer is based on reflective diffraction, using the spiral grooves on a CD to produce interference and separate wavelengths of visible light.

| Symbol | Description |
|---|---|
| m | Diffraction order (set to m = 1) |
| λ | Wavelength (in nm) |
| d | Grating spacing (CD ≈ 1.6 μm) |
| α | Angle of incidence (59° in this design) |
| β | Angle of diffraction, varies by wavelength |
Assuming a 13 mm internal light path, the diffraction angles calculated above would project a visible spectrum band approximately 2.87 mm wide on a typical smartphone camera sensor (which is around 8–9 mm in width). This setup clearly displays the transition from violet to red wavelengths, ideal for real-time spectral observation.

Sample Spectral Images
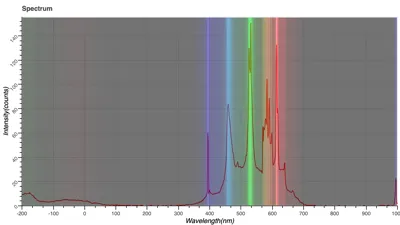
Here are real images captured using this spectrometer and a smartphone. You can clearly observe the spread of visible wavelengths from violet to red, with distinct spectral features for each light source.

Calibration & Analysis Results
Using known light sources (e.g., laser pointers, green LEDs), you can calibrate pixel positions against their respective wavelengths.
With image processing tools like ImageJ, you can convert the spectrum image into grayscale intensity plots and analyze RGB channel responses—perfect for building your own material spectrum reference library.

How to Calibrate a Spectrum Image Using ImageJ and Excel
When you capture a spectral image, whether from a DIY spectrometer or a lab-grade setup. You're usually left with a photo where the x-axis is measured in pixels, not wavelengths.
To extract meaningful data from this image, you need to calibrate it: map pixel positions to real physical wavelengths.
This guide walks you through how to do just that using ImageJ and Excel. It's perfect for students, hobbyists, and makers working on light optical projects.
Why Calibrate a Spectrum Image?
The x-axis of a raw spectral image only shows pixel positions. To interpret the data physically, like identifying specific emission lines or absorption bands, you must convert those pixel values into actual wavelengths. This is called wavelength calibration.
You’ll use a light source with known emission lines (such as a fluorescent bulb, mercury lamp, or gas discharge tube) to match pixel positions to real-world wavelengths.
What You’ll Need
ImageJ: A free, open-source image analysis tool.
Download it from: https://imagej.net/ij/
- Spectroscope App (optional): capture, calibrate, and analyze light spectra in real time.
Download it from: https://www.majinsoft.com/education.php - Excel or Google Sheets: For organizing data and performing curve fitting.
A spectral image of a known light source: Fluorescent lamps are great. They have sharp emission lines at well-known wavelengths.

Step 1: Extract Pixel Intensity Profile in ImageJ
Open the Spectral Image
Launch ImageJ and go to File > Open. Choose your spectrum image (JPG, PNG, or TIFF works).
Ensure Left = Blue, Right = Red
Make sure the spectrum is oriented correctly: blue (short wavelengths) should be on the left, red (long wavelengths) on the right.
- If it’s reversed, go to Image > Transform > Flip Horizontally or use Rotate to correct it.
- If the spectrum is tilted, use Image > Transform > Rotate... to fine-tune the angle and align the spectral band horizontally.

Select a Horizontal Area
Use the rectangular selection tool to highlight a horizontal strip across the spectrum. Try to align it with the axis of the spectral lines.
Generate the Profile Plot
Go to Analyze > Plot Profile. A graph of intensity vs. pixel position will appear.

Export the Data
Click List on the profile plot window to view the raw data. Select all (Ctrl+A) and copy (Ctrl+C). Paste it into Excel, you’ll see two columns: Pixel and Intensity.

Step 2: Identify Known Wavelength Peaks
Find Known Peaks
Look up the emission lines for your calibration source. For example, a typical fluorescent lamp may show:
- 611 nm
- 546 nm
- 435.8 nm
- Match Pixel Positions to Wavelengths
- Go to Analyze > Tools > Curve Fitting, this opens the Curve Fitter dialog.
Press the Delete key on your keyboard to clear any default numbers shown in the window.

Use your Excel data to find the pixel positions of these peaks (the local intensity maxima), and create a reference table:

After entering the data, click “Fit” in the Curve Fitter window. Two new windows will appear:

y = a + bx: This displays the linear fit equation. For example:
y = 409.01234 + 0.17534x
This means: Wavelength = 409.01234 + 0.17534 × Pixel
- Log: Shows fitting process details and statistics like R² value.
Step 3: Create a Calibration Curve in Excel
Now that you have your calibration formula, you can convert any pixel value into its corresponding wavelength simply by applying the equation.
- Use your calibration formula to convert pixel values into wavelengths:
Wavelength(nm) = 409.01234 + 0.17534 * A2 - Normalize intensity for better comparison by converting to percentage:
Intensity(counts) = (B2/Max_Gray_Value)*100
In the Profile Plot generated by ImageJ, the intensity values are based on the pixel brightness or grayscale level in the image. If certain areas of your spectral image are very bright, some pixels may reach saturation, resulting in intensity values well over 100. To make your spectrum easier to interpret and compare visually, it’s often helpful to normalize the intensity values in Excel.
This scales the data to a consistent 0–100% range, making plots across different light sources or exposure settings easier to compare.

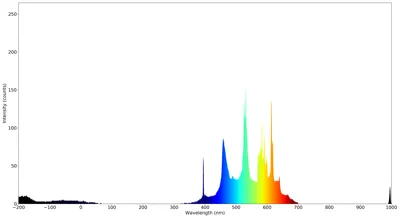
Step 4: Plot Wavelength (nm) vs. Intensity (%)
With your new calibrated data, you can plot a true spectrum: Wavelength (X) vs. Intensity (Y). This chart gives you a real, physics-based view of the light source and is suitable for comparison or analysis.

Excel sample file:
Changelog
All notable changes to this project will be documented in this file.
This changelog adheres to the Keep a Changelog format.
[v2] - 2025-05-30
Changed
- Added locking slots to Neutral Hood and Lens Hood to improve stability and prevent detachment
[v1] - 2025-05-27
Added
- Initial release, including the smartphone spectrometer body, slit module, and camera alignment structure
References
- Theremino Spectrometer Sample Spectrums
- Theremino Spectrometer Diffraction gratings
- Theremino Spectrometer Technology
- Make your own CD spectrometer
- Jim's Homemade Spectrometers
☕ Enjoying the design?
If you found this design helpful and would like to support my work, feel free to buy me a coffee!
👉 https://buymeacoffee.com/shuwn
License
You shall not share, sub-license, sell, rent, host, transfer, or distribute in any way the digital or 3D printed versions of this object, nor any other derivative work of this object in its digital or physical format (including - but not limited to - remixes of this object, and hosting on other digital platforms). The objects may not be used without permission in any way whatsoever in which you charge money, or collect fees.
Comment & Rating (39)